Southern California transit infrastructure remains one of the most complex, heavily trafficked networks in the United States. For commuters traversing Los Angeles, Orange County, Riverside, San Bernardino, and San Diego, real-time data ingestion is a daily operational necessity. Sigalert has established itself as an indispensable utility for parsing live traffic feeds, incident reports, and average speeds across this massive metropolitan grid. Understanding how to leverage this platform alongside regional transit frameworks ensures optimal route planning and minimized delay times throughout the 2026 commuter landscape.
The Architecture of Southern California Traffic Data
Real-time traffic management relies on a vast array of hardware and software integrations. Sigalert aggregates telemetry from multiple authoritative sources to provide up-to-the-minute updates for Southern California motorists.
- Caltrans Performance Measurement System (PeMS): Integrates loop detectors embedded in freeway pavement to capture volume, occupancy, and speed data continuously.
- CHP (California Highway Patrol) Incident Feeds: Direct CAD (Computer-Aided Dispatch) feeds that log collisions, stalled vehicles, debris hazards, and lane closures the moment dispatchers record them.
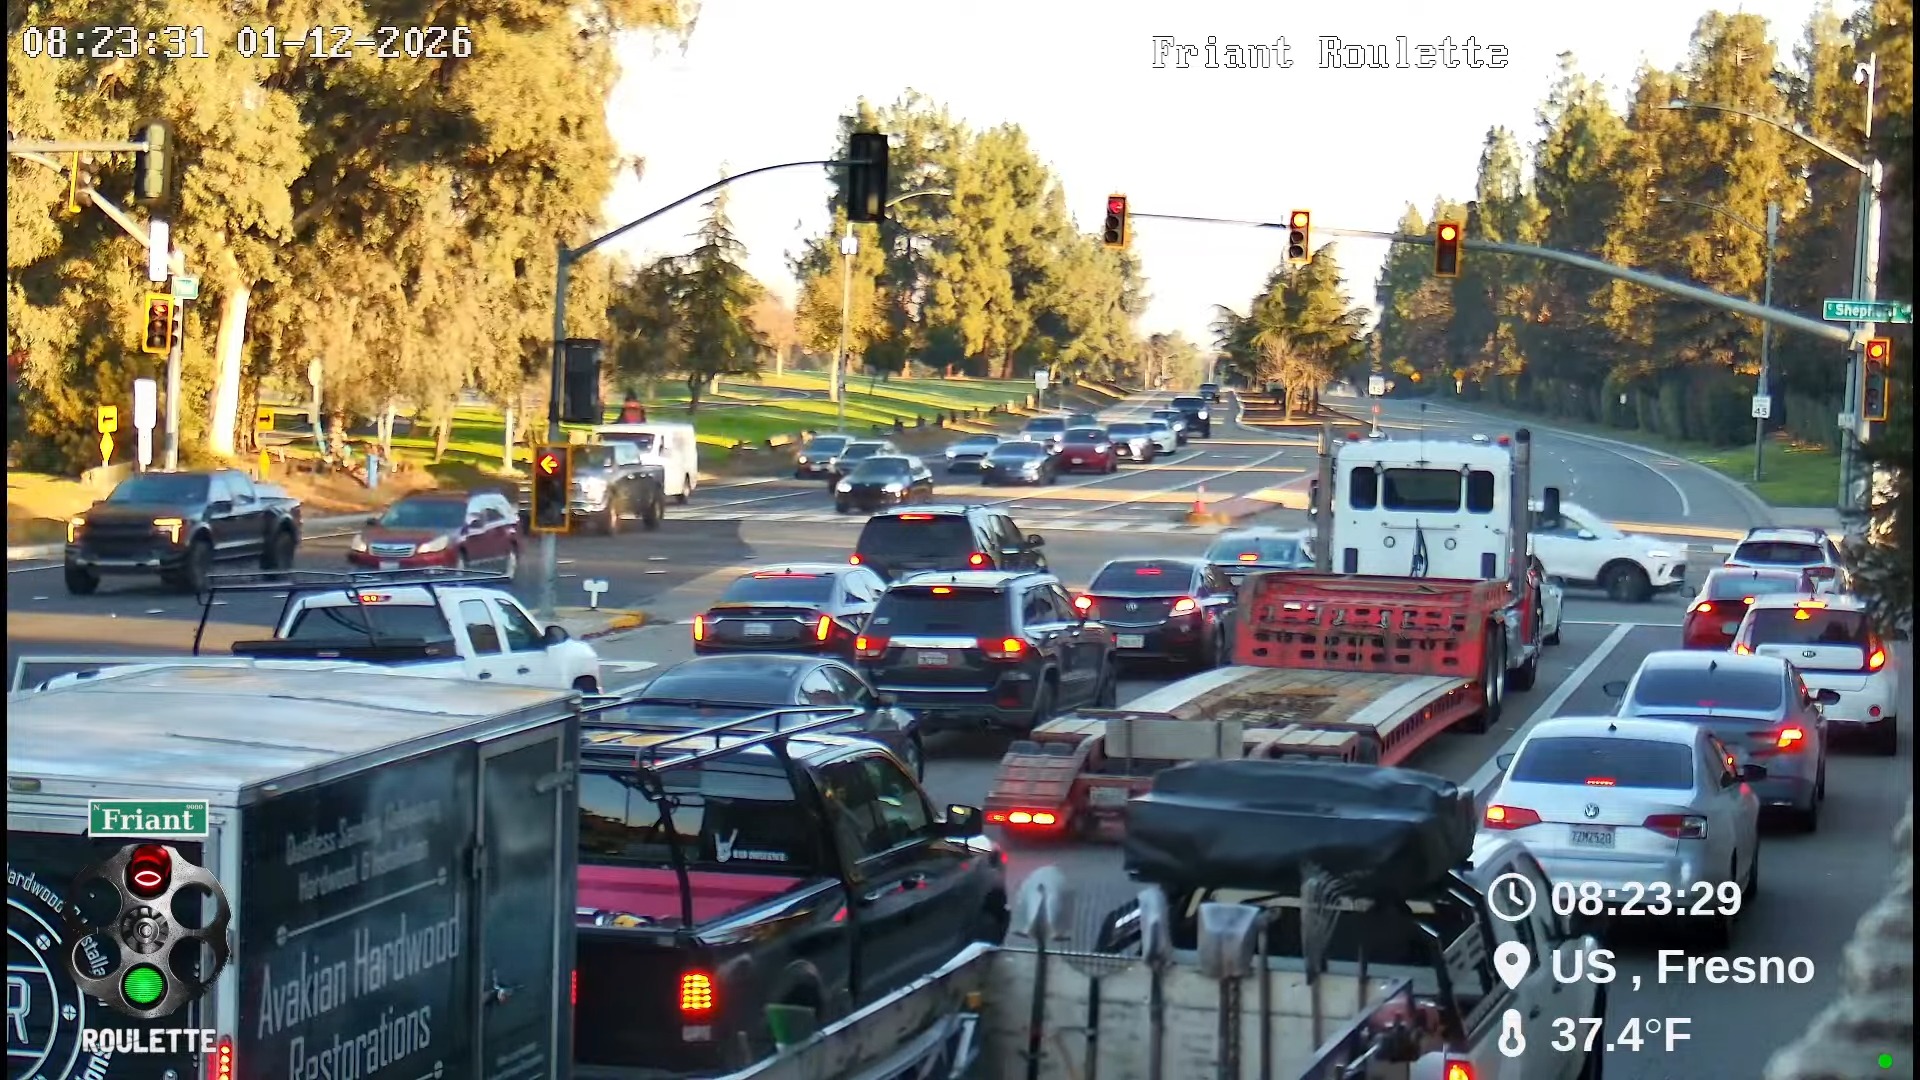
- CCTV Camera Feeds: Optical feeds deployed along major interstate corridors including the I-5, I-10, I-405, and SR-91, allowing visual verification of gridlock and accident scenes.
- Crowdsourced Telemetry: Anonymized GPS probe data from connected vehicles and mobile application users that refines travel time estimates during sudden congestion spikes.
Major Freeway Corridors and High-Density Bottlenecks
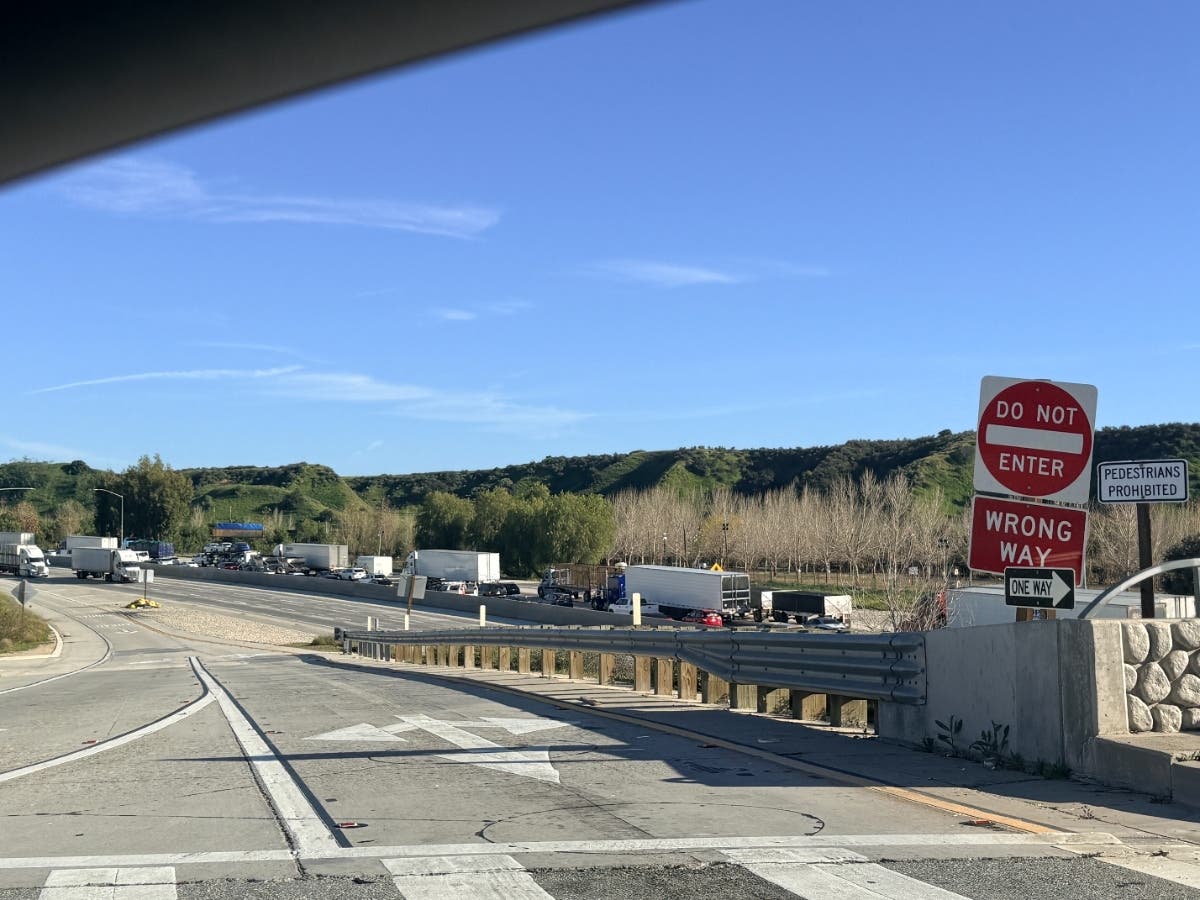
Southern California's geography creates natural bottlenecks where commercial and commuter traffic converge. Utilizing Sigalert live traffic data helps drivers anticipate slowdowns across these critical arterial routes.
| Freeway Corridor | Primary Geographic Reach | Typical Peak Congestion Zones | Primary Contributing Factors |
|---|---|---|---|
| Interstate 405 (San Diego Freeway) | Orange County to the San Fernando Valley | Sepulveda Pass, West LA, Costa Mesa | High commuter volume, limited alternative routing options |
| Interstate 10 (Santa Monica Freeway) | Santa Monica to San Bernardino County | Downtown LA, East LA Interchange, San Gabriel Valley | Heavy freight movement, merge points with I-5 and I-110 |
| State Route 91 (Riverside Freeway) | Orange County to Riverside County | Weir Canyon, Corona Express Lanes transition | Massive trans-mountain commuter base, bottleneck merging |
| Interstate 5 (Golden State / Santa Ana Freeway) | Mexican Border to the Grapevine | Downtown LA, Santa Ana, Orange "Orange Crush" | Commercial trucking artery, heavy regional mixing |
Actionable Strategy for Real-Time Route Optimization
Relying solely on static GPS mapping can lead drivers directly into developing accidents. A systematic approach to monitoring live traffic channels provides a distinct advantage.
- Establish Baseline Monitoring: Check Sigalert desktop or mobile interfaces fifteen minutes prior to departure to observe baseline speeds across your intended corridor.
- Filter by Incident Type: Toggle display settings to show only injury accidents, hazardous spills, or major construction zones rather than general slow traffic, allowing you to gauge the severity of an obstruction.
- Evaluate Alternate Arterials: When primary freeways experience total closures due to major collisions, identify parallel surface streets such as Ventura Boulevard, Wilshire Boulevard, or major county highways that maintain higher throughput ratings.
- Set Custom Alerts: Configure automated text or push notifications for specific highway segments to receive immediate warnings when average speeds drop below established thresholds.
Operational Strategy for Regional Commuters When navigating high-confluence zones like the East LA Interchange or the I-10/I-405 junction during peak 2026 commuting windows, maintaining situational awareness via live telemetry prevents drivers from becoming trapped behind secondary accidents that frequently occur within existing backups.
Comparative Analysis of Transit Intelligence Platforms
While Sigalert provides robust speed mapping and incident reporting, drivers often weigh its utility against other prominent navigation tools. Evaluating the strengths and limitations of each platform ensures motorists deploy the right tool for specific transit scenarios.
- Sigalert: Excels at raw data transparency, displaying exact average speeds, official CHP log timestamps, and granular sensor data straight from Caltrans feeds with minimal algorithmic obfuscation.
- Waze: Highly effective for community-reported hazards, speed traps, and sudden object-in-road alerts, though routing logic can occasionally divert heavy traffic onto fragile residential side streets.
- Google Maps: Provides comprehensive multi-modal transit integration, predictive arrival modeling, and broad commercial business mapping, but relies heavily on closed-box proprietary routing algorithms.
- Apple Maps: Offers clean visual interfaces and lane-level guidance, optimized tightly for iOS hardware ecosystems, with steady improvements in incident reporting density.
Frequently Asked Questions
How frequently does Sigalert update its live traffic speeds in Southern California?
Sigalert updates its speed maps and flow indicators continuously every few minutes, pulling fresh telemetry directly from Caltrans loop detectors and active GPS probe streams. This high-frequency refresh rate ensures drivers view near-instantaneous changes in freeway conditions.
Are CHP incident reports displayed immediately on Sigalert?
Yes, California Highway Patrol computer-aided dispatch data feeds into the system with minimal latency, usually appearing within moments of a dispatcher logging a collision, hazard, or stalled vehicle. However, minor fender-benders may take slightly longer to verify and categorize.
Can I access historical traffic data on Sigalert to plan future travel times?
Sigalert primarily functions as a real-time monitoring and forecasting utility, but users can observe typical traffic patterns and average speeds for specific days of the week to estimate future transit durations. For precise multi-week planning, combining live feeds with historical congestion charts yields the best results.
What should I do if a Sigalert route shows sudden gridlock ahead?
When an unexpected bottleneck or accident appears on your route, check the incident details to determine if lanes are completely blocked. If traffic is halting entirely, use the map to identify the nearest off-ramp before the backup point and redirect via designated surface street alternates.
Does Sigalert cover toll lanes and express lanes in Southern California?
Yes, the platform tracks flow rates across major managed lanes, including the SR-91 Express Lanes and the I-10/I-110 Metro ExpressLanes, helping motorists decide whether paying a toll is justified by current time savings.
Optimizing Your Daily Commute
Mastering the intricacies of Southern California traffic requires combining authoritative telemetry tools with disciplined pre-trip planning. By actively monitoring Sigalert live traffic data, identifying high-risk bottlenecks before departure, and maintaining flexibility with alternate surface routes, commuters can significantly reduce transit stress and travel times across the region.